
Unlocking SAP HANA Performance with PowerConnect for Splunk
How IT Leaders Can Gain Critical Visibility, Reduce Risk, and Improve Decision-Making with Real-Time SAP HANA Monitoring
This article was authored by Maria Yazar, Director of Customer Success at RHONDOS.
Why SAP HANA Monitoring Still Falls Short
Despite being the digital core for many enterprises, SAP HANA often operates in a visibility vacuum. IT teams frequently rely on post-incident log reviews, custom scripts, or siloed tools to detect performance issues. For IT Directors and VPs responsible for SAP Solutions, this results in unnecessary delays, unplanned outages, and missed service-level expectations.
Common pain points include:
Long-running queries with no early warning system may lead to work and document flow disruptions.
Blocked transactions delaying critical business processing or job execution impacting all lines of business whether it is Supply Chain, HCM or Finances.
Spikes in memory usage with no correlation to user or workload behavior that impacts overall system performance and end user experience.
Gaps in audit traceability or insufficient historical data for root cause analysis slow down issues resolution.
Lack of predictive analytics or AI-based forecasting.
Delays in identifying performance degradation before it affects users.
Too many false positives or non-critical alerts and Lack of intelligent alert correlation
How PowerConnect for Splunk Bridges the Gap
RHONDOS with PowerConnect for Splunk transforms how enterprises monitor and manage SAP HANA. By extracting native HANA telemetry and integrating it into Splunk, organizations gain:
Real-time dashboards purpose-built for SAP HANA use cases
Correlated metrics and logs to accelerate triage and eliminate guesswork
Historical trends to identify anomalies and plan capacity effectively
Operational insights aligned with both IT performance and business impact
Real-time alerts notify respective IT teams before an issue occurs and causes any disruption
This level of observability is not just a convenience—it’s a necessity for high-availability, critical systems.
Dashboard Deep Dive:
1.HANA Blocked Transactions

HANA Blocked Transactions provides visibility into transaction-level locking conflicts that can degrade database performance and user experience. It helps identify when a transaction is waiting for a lock held by another session, revealing blocking chains, wait times, and the specific SQL statements or users causing the blockage. This is critical for troubleshooting performance issues like application hangs, long-running jobs, or timeouts, as even one blocked transaction can cause cascading delays in an SAP system
Outcome: Cuts resolution time by isolating root causes in seconds, not hours.
2. HANA Expensive Statements (Raw)
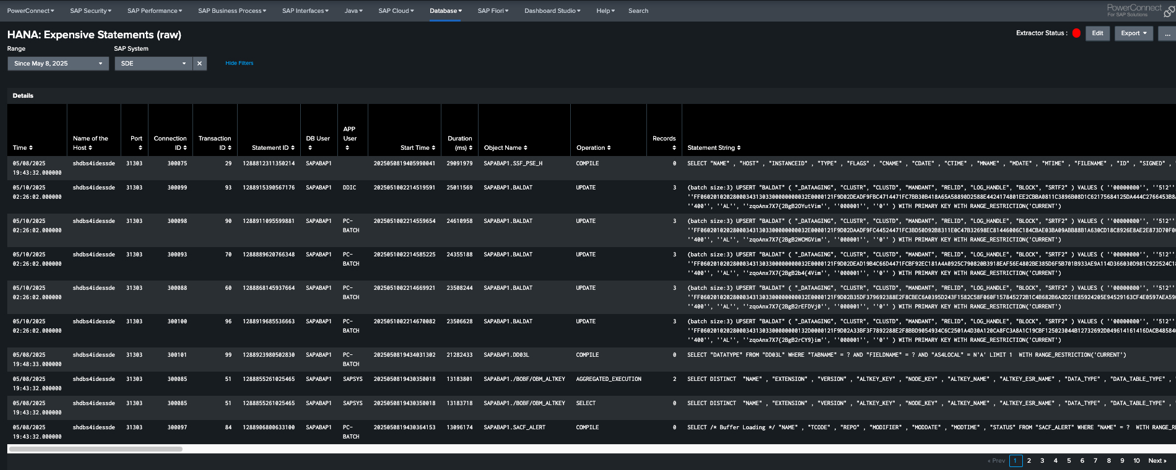
Monitoring SAP HANA Expensive Statements is essential because it helps identify SQL queries or procedures that consume excessive system resources—such as CPU, memory, or execution time—and therefore pose a risk to overall database performance and stability. These statements can originate from poorly written custom code, inefficient SAP standard processes, or ad-hoc queries that are not optimized for the HANA in-memory architecture.
Outcome: Helps development and DBA teams prioritize query tuning based on real execution cost.
3. HANA System Resource Utilization


HANA Overview gives insights on CPU, memory, storage, alerts, and system activity that provides critical visibility into the health and performance of both the database and the underlying host infrastructure. Metrics like DB CPU Utilization (%), Host CPU Utilization (%), and their comparative ratios help determine whether performance issues are caused by SAP HANA itself or other processes on the host. Similarly, tracking DB vs Host Memory Utilization (%) and HANA Heap Memory Usage helps identify memory bottlenecks, leaks, or over-committed systems, allowing for more accurate capacity planning and resource optimization.
Storage and availability metrics, such as HANA DB Space, Host Storage Overview, and Number of Services Not Running, ensure that disk usage and service uptime are continuously monitored, helping prevent outages due to full volumes or service failures. Additionally, insights from HANA Alerts, Audit Events, and Trace Logs support early detection of system issues and security-related events. By combining these technical metrics with workload-level views like Executed Queries by Schema and Running Threads, administrators can analyze performance trends, troubleshoot bottlenecks, and ensure that the system is both secure and efficiently handling business processes. Together, these KPIs provide a comprehensive framework for maintaining a stable, high-performing SAP HANA environment.
Outcome: for an SAP Basis consultant, monitoring these SAP HANA KPIs is invaluable because it directly supports their core responsibilities of ensuring system stability, performance, and availability. By keeping a close eye on CPU and memory utilization, both at the database and host levels, a Basis consultant can quickly identify resource bottlenecks, imbalances, or unusual spikes that might affect overall system health. This proactive monitoring enables timely capacity planning, tuning, and troubleshooting, preventing performance degradation before end users are impacted.
Moreover, monitoring storage space, service statuses, alerts, and audit logs help the Basis consultant maintain high system availability and security compliance. They can detect failing services, disk space issues, or security events early, ensuring smooth operation and adherence to company policies or regulatory requirements. Insights into query workloads and thread activity also empower the consultant to collaborate effectively with developers and DBAs, optimizing database operations and resolving concurrency or locking issues. Overall, these KPIs provide the Basis team with a comprehensive and actionable view, making their job of maintaining a robust SAP landscape much more efficient and reliable.
4. HANA Backup Insights

Displays service-level success, duration, and backup sizes for audit and Disaster Recovery validation.
Outcome: Enables SAP Basis teams to maintain backup compliance and track trends. Tracks backup sizes over time. Helps manage backup retention policies and avoid running out of disk space and forecast storage needs
5. HANA Large Table Overview

Identifies top tables by memory usage, record count, and read/write activity, Highest record count and Highest Allocated Size
Outcome: Monitoring column and row tables in SAP HANA is crucial for optimizing memory usage, query performance, and overall system efficiency. Column store tables, designed for analytical workloads, often consume more memory but offer faster read performance, while row store tables are suited for fast lookups and small transactional datasets. By monitoring key metrics such as memory consumption, record counts, delta merge statistics (for column tables), and load status, administrators can identify performance bottlenecks, ensure optimal data modeling, and decide whether tables need to be moved between storage types. This helps prevent memory pressure, improves query response times, and supports effective capacity planning, especially in systems with mixed OLTP and OLAP workloads.
6. HANA Large Table Details

Shows load status, partition size, merge count, and last merge time for column and row tables.
Outcome: Provides insights for Basis teams to tune memory management and improve loading efficiency.
7. HANA Threads and Services View


Trace thread execution state, active status, memory per service, and type of workload (job, remote service).
Outcome: Validates system behavior under peak load conditions and during background processing.
Business Value for SAP and Infrastructure Leadership
For VPs of Technology and SAP program leaders, PowerConnect for Splunk provides tangible benefits:
Faster incident resolution: Reduce MTTR by up to 70% with precise diagnostics
Better system reliability: Proactively identify risks before they become outages
Increased transparency: Improve communication between Basis, Infra, and DevOps
Informed planning: Use historical trends to guide hardware provisioning and patch scheduling
Whether you're optimizing HANA sizing or ensuring 24/7 uptime for critical processes, PowerConnect adds context and control that log-based tools simply can’t match.
Conclusion
PowerConnect for Splunk isn't just a monitoring solution—it's an enabler of smarter SAP operations. For enterprise teams who need to deliver high performance, maintain audit compliance, and drive digital outcomes, this visibility level is a key differentiator.